4.2 Investor Information
Share information
| Exchange | Oslo Stock Exchange |
| ISIN | BMG4233B1090 |
| Ticker | HAFNI |
| Currency | NOK |
| Class of shares | 1 |
| OTCQX symbol | HAFNF |
| Number of shares (Including treasury shares) | 506,820,170 |
Dividend policy
In November of 2022, Hafnia updated its dividend policy to allow greater shareholder value should we meet our objectives.
Starting from the fourth quarter of 2022, we will target a quarterly payout ratio of net profit, adjusted for extraordinary items, of:
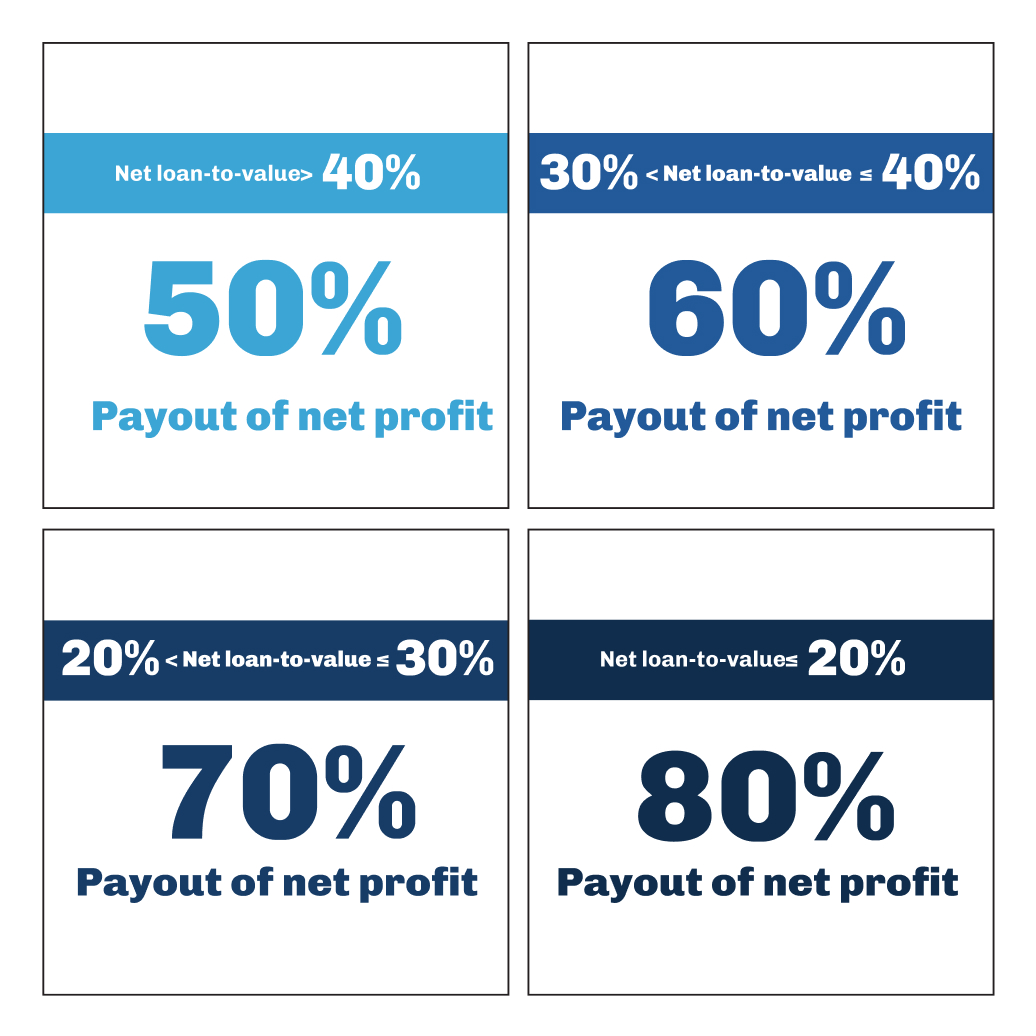
Net loan-to-value is calculated as vessel bank and finance lease debt (excluding debt for vessels sold but pending legal completion) less cash divided by broker vessel values (100% owned vessels).
The final dividend amount is to be decided by the Board of Directors.
In addition to cash dividends, the Company may buy back shares as part of its total distribution to shareholders.
In deciding whether to declare a dividend and determining the dividend amount, the Board of Directors will take into account the Group’s capital requirements, including capital expenditure commitments, financial condition, general business conditions, legal restrictions, and any restrictions under borrowing arrangements or other contractual arrangements in place at the time.
There can be no assurance that a dividend will be declared in any given year. If a dividend is declared, there can be no assurance that the dividend amount or yield will be as contemplated above.
Hafnia’s historical dividends
| Financial period | Dividend amount (USDm) | Dividend per share (USD) |
| Q4 2019 | 21.2 | 0.0573 |
| Q1 2020 | 38.6 | 0.0573 |
| Q2 2020 | 38.6 | 0.0573 |
| Q1 2022 | 10.5 | 0.0573 |
| Q2 2022 | 93.1 | 0.0573 |
| Q3 2022 | 140.1 | 0.0573 |
| Q4 2022 | 159.0 | 0.315740 |
Composition of shareholders
As of 13 March 2023, Hafnia has 5,050 registered shareholders
below is a list of the 20 largest shareholders as of 13 March 2023:
| # | Shareholder Name | No. of Shares | Percentage (%) |
| 1 | BW GROUP LIMITED | 246,106,112 | 48.56% |
| 2 | The Bank of New York Mellon | 37,085,026 | 7.32% |
| 3 | FOLKETRYGDFONDET | 16,332,248 | 3.22% |
| 4 | J.P. MORGAN SECURITIES PLC | 6,303,135 | 1.24% |
| 5 | Danske Bank A/S | 6,744,261 | 1.33% |
| 6 | The Bank of New York Mellon SA/NV | 16,298,010 | 3.22% |
| 7 | Interactive Brokers LLC | 5,745,830 | 1.13% |
| 8 | Morgan Stanley & Co. International | 5,079,829 | 1.00% |
| 9 | State Street Bank and Trust Comp | 13,778,649 | 2.72% |
| 10 | Goldman Sachs International | 4,571,162 | 0.90% |
| 11 | SKANDINAVISKA ENSKILDA BANKEN AB | 9,622,692 | 1.90% |
| 12 | SONGA CAPITAL AS | 3,500,000 | 0.69% |
| 13 | CLEARSTREAM BANKING S.A. | 3,490,223 | 0.69% |
| 14 | JPMorgan Chase Bank | 10,287,405 | 2.03% |
| 15 | VERDIPAPIRFONDET STOREBRAND NORGE | 3,159,022 | 0.62% |
| 16 | VERDIPAPIRFONDET ALFRED BERG GAMBA | 2,505,268 | 0.49% |
| 17 | Citibank | 5,302,938 | 1.05% |
| 18 | Nordnet Bank AB | 2,265,964 | 0.45% |
| 19 | Goldman Sachs & Co. LLC | 2,254,259 | 0.44% |
| 20 | Morgan Stanley & Co. LLC | 3,117,073 | 0.62% |
| Other shareholders | 103,271,064 | 20.38% | |
| Total | 506,820,170 | 100% |
Stock Data, Ticker Code
Financial calendar
| Financial Year 2023 | |
| 28 February 2023 | Quarterly report – Q4 |
| 30 March 2023 | Annual report 2022 |
| 18 May 2023 | Annual general meeting |
| 19 May 2023 | Quarterly report – Q1 |
| 25 August 2023 | Half-yearly report |
| 17 November 2023 | Quarterly report – Q3 |

Investor Relations contact
THOMAS ANDERSEN
EVP, Head of Investor
Relationstha@hafniabw.com
Analyst Coverage
| Company | Analyst | Email address |
| ABG Sundal Collier | Petter Haugen | petter.haugen@abgsc.no |
| Arctic Securities | Lars Østereng | lars.ostereng@arctic.com |
| Clarksons Platou Securities AS | Frode Mørkedal | frode.morkedal@clarksons.com |
| Danske Bank | Håvard Sjursen Lie | hvli@danskebank.com |
| DNB | Jørgen Lian | jorgen.lian@dnb.no |
| Fearnley Securities | Øystein Vaagen | o.vaagen@fearnleys.com |
| Jefferies | Omar Noktar | onokta@jefferies.com |
| Pareto Securities AS | Eirik Haavaldsen | eha@paretosec.com |
| Skandinaviska Enskilda Banken (SEB) | Frederik Ness | frederik.ness@seb.no |