1.2 Hafnia: A Year in Review
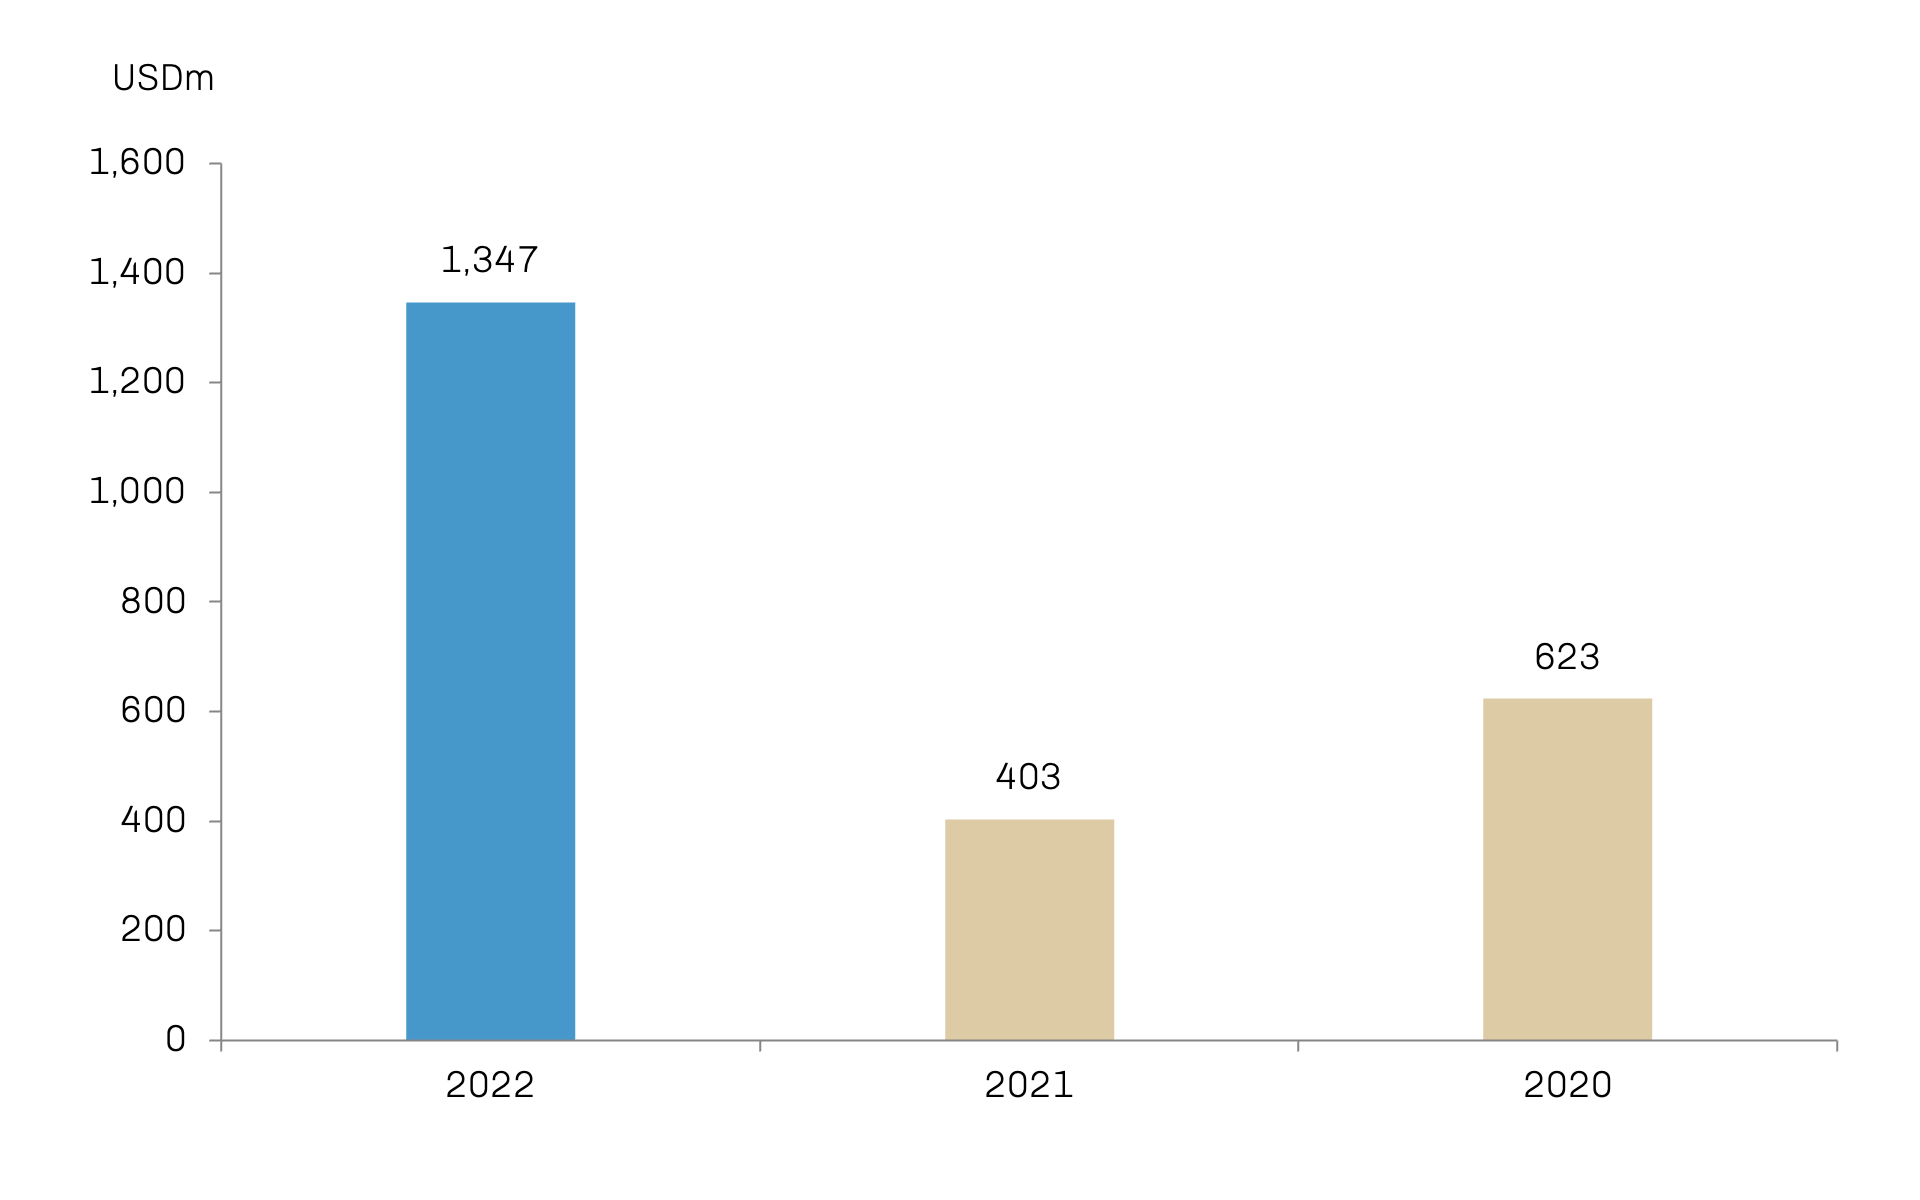
TCE Income
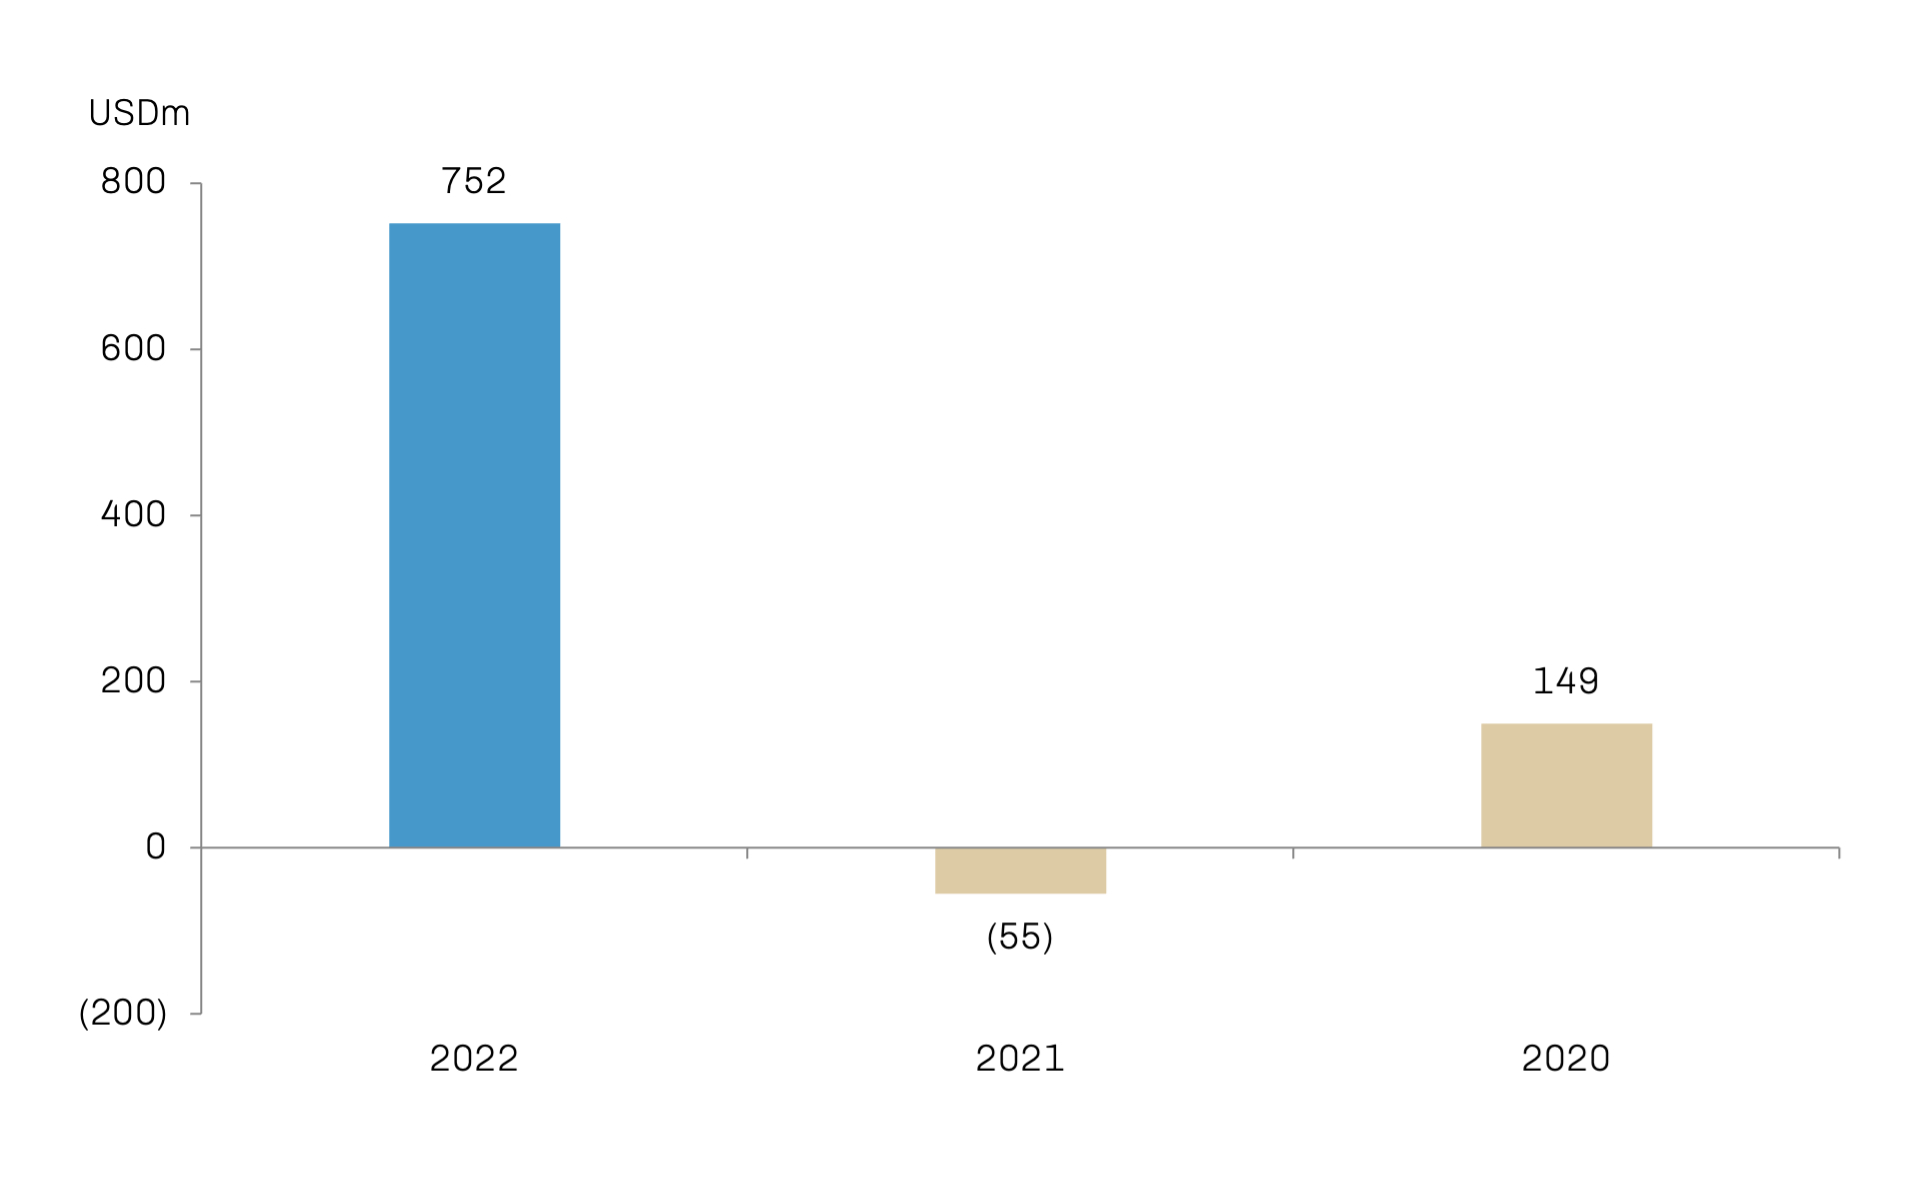
Net Profit/(Loss)
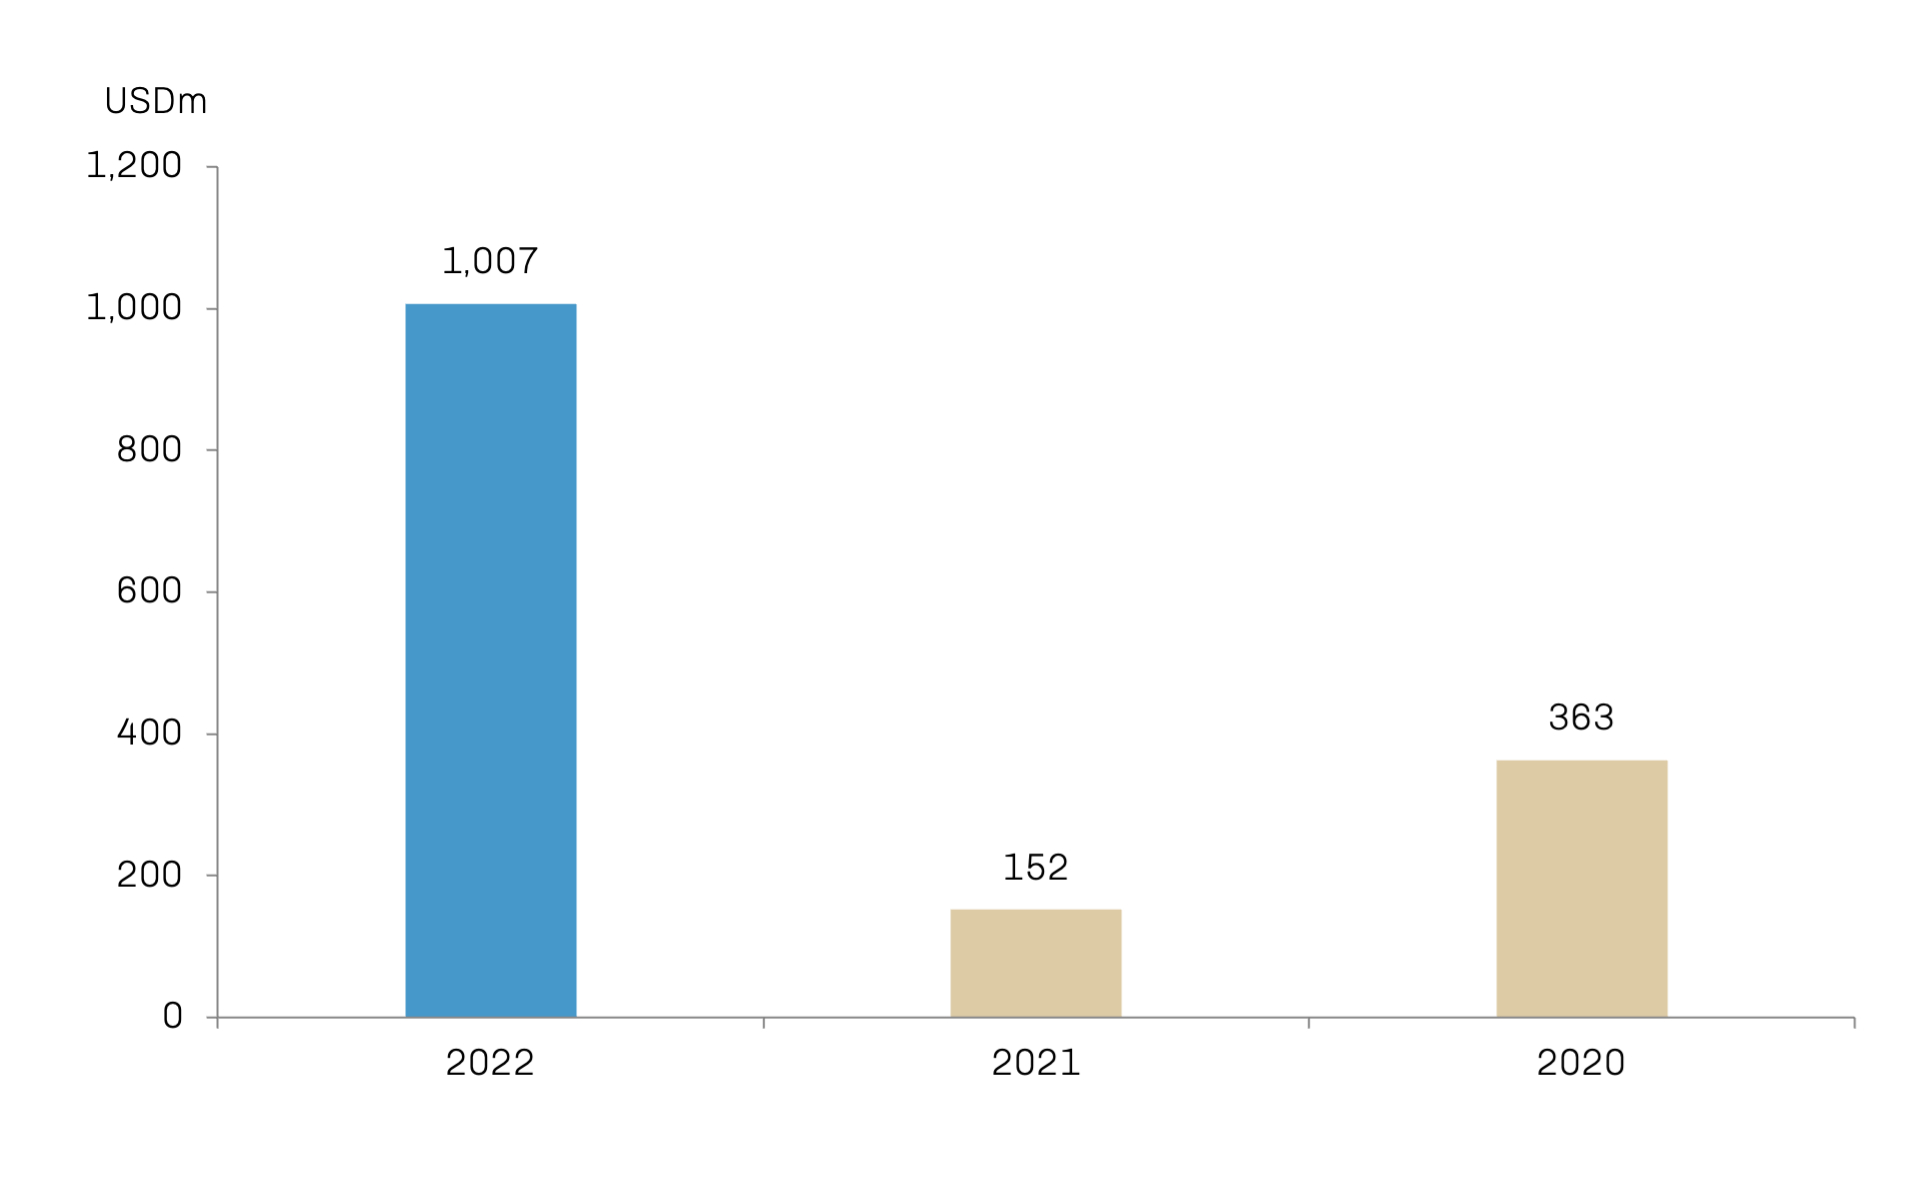
EBITDA
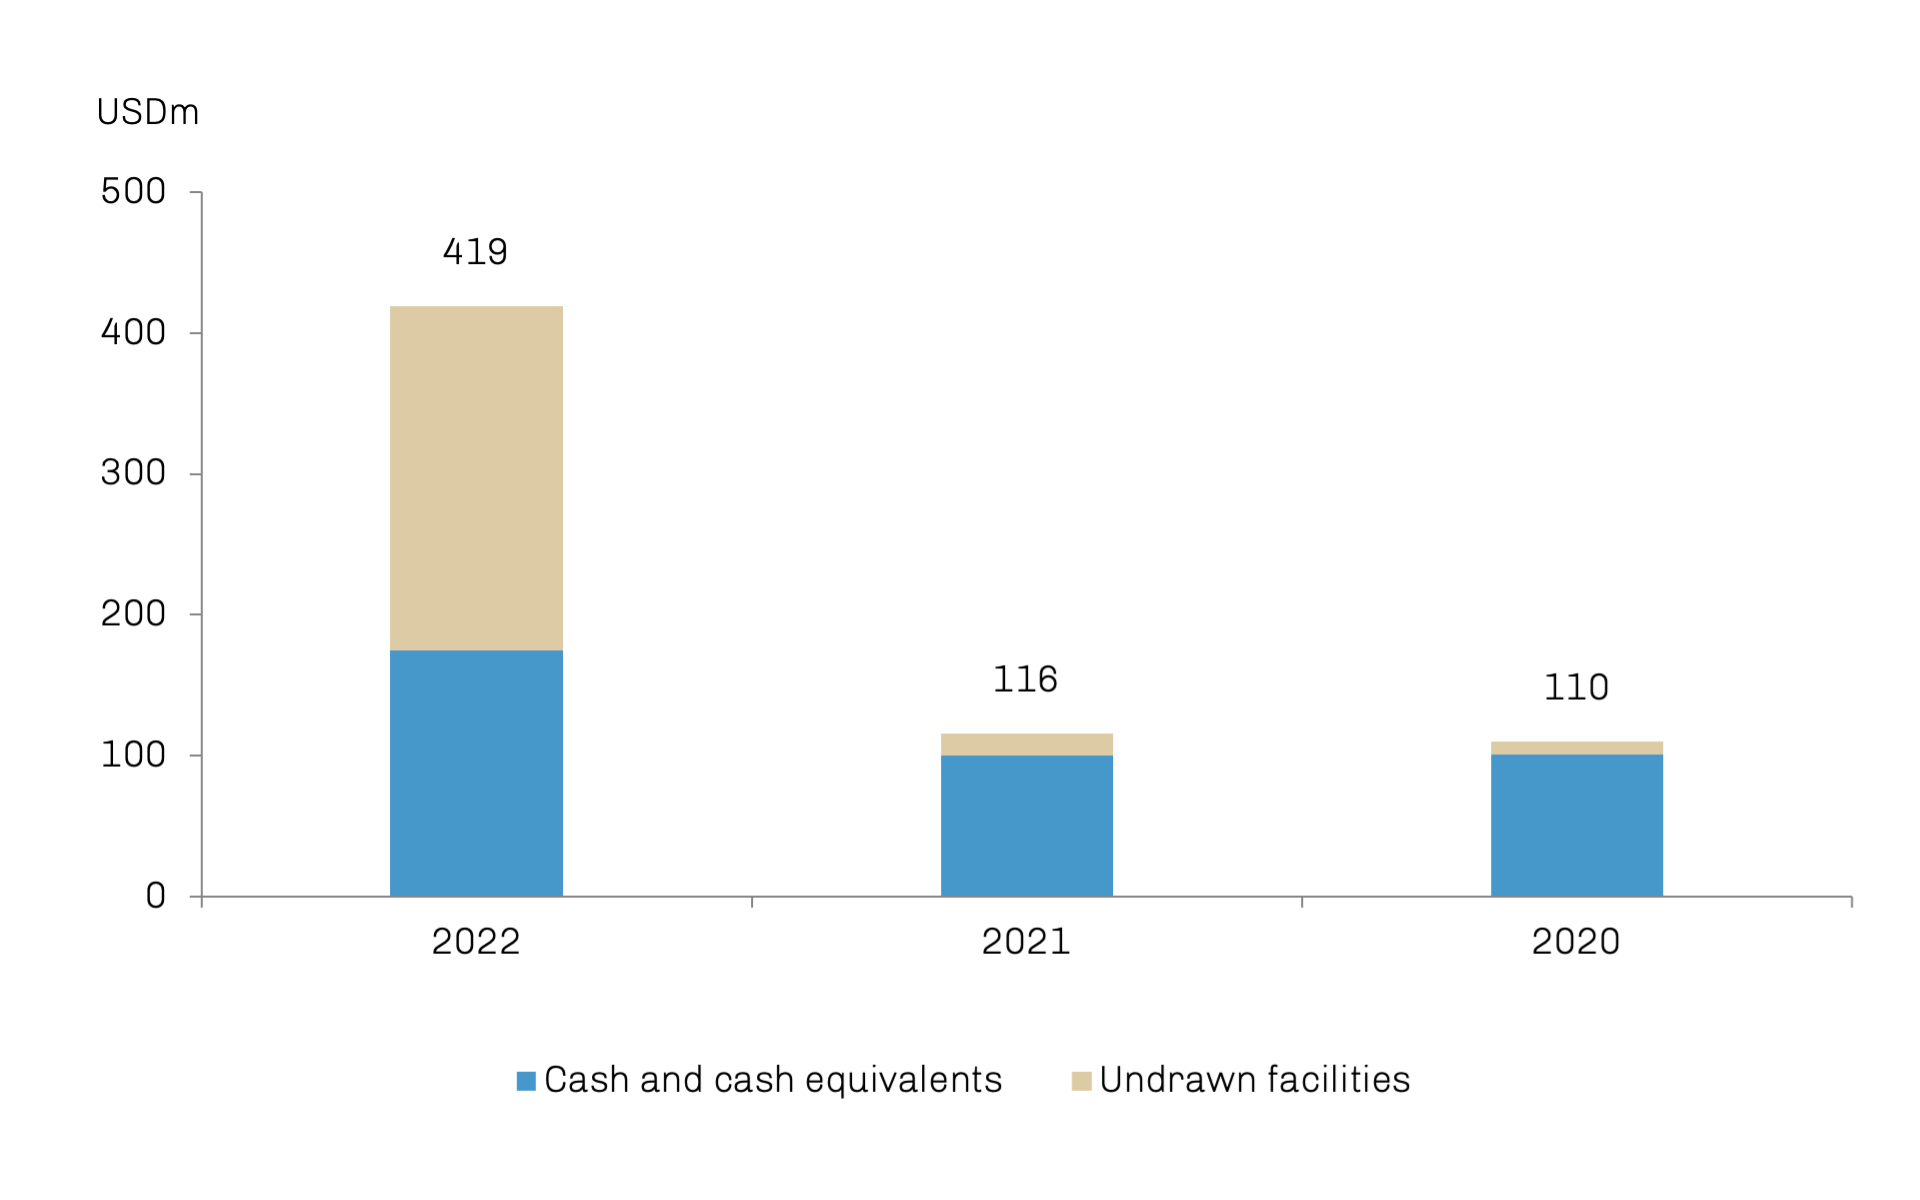
Total Liquidity
| Key Financial Figures USD million |
Q1 2022 | Q2 2022 | Q3 2022 | Q4 2022 | Full Year 2022 |
Income Statement |
|||||
|---|---|---|---|---|---|
| Operating revenue | 267.3 | 467.8 | 522.4 | 575.1 | 1,832.6 |
| TCE income | 163.4 | 348.3 | 407.6 | 427.4 | 1,346.7 |
| EBITDA | 87.5 | 257.5 | 326.0 | 335.9 | 1,006.9 |
| Operating profit (EBIT) | 36.7 | 206.9 | 298.2 | 281.4 | 823.2 |
| Financial items | (15.7) | (24.8) | (24.4) | (24.2) | (89.1) |
| Share of profit from associate and joint ventures | 1.1 | 7.2 | 7.9 | 8.0 | 24.2 |
| Profit before tax | 22.0 | 189.4 | 281.6 | 265.3 | 758.3 |
| Profit for the period | 21.3 | 186.2 | 280.3 | 263.8 | 751.6 |
Balance Sheet |
|||||
| Total assets | 3,715.4 | 4,065.9 | 3,943.8 | 3,918.9 | 3,918.9 |
| Total liabilities | 2,331.8 | 2,391.7 | 2,057.4 | 1,909.9 | 1,909.9 |
| Total equity | 1,383.6 | 1,674.2 | 1,886.4 | 2,009.0 | 2,009.0 |
| Cash and cash equivalents | 74.0 | 87.5 | 151.5 | 174.4 | 174.4 |
Key Financial Figures |
|||||
| Return on Equity (RoE) (p.a.)1 | 6.8% | 53.5% | 74.8% | 67.6% | 48.2% |
| Return on Invested Capital (p.a.)1,2 | 5.1% | 27.6% | 41.1% | 38.6% | 28.3% |
| Equity ratio | 37.2% | 41.2% | 49.1% | 51.9% | 51.9% |
| Net loan-to-value (LTV) ratio3 | 64.0% | 55.7% | 43.0% | 37.2% | 37.2% |
| 2022 | LR2 | LR1 | MR | Handy | Chemical MR | Chemical Handy | Chemical Stainless | Total |
|
Vessels on water at the end of the period 4 |
6 | 34 | 50 | 6 | 6 | 18 | – | 120 |
|
Total operating days 5 |
2,188 | 11,758 | 18,022 | 3,156 | 1,894 | 5,919 | 1,538 | 44,475 |
|
Total calendar days (excluding TC-in) |
2,190 | 10,406 | 14,965 | 3,240 | 2,004 | 6,012 | 1,607 | 40,424 |
|
TCE (USD per operating day) |
33,563 | 35,826 | 30,113 | 23,351 | 31,481 | 24,910 | 18,446 | 30,274 |
|
OPEX (USD per calendar day)6 |
7,443 | 7,387 | 7,039 | 6,702 | 7,269 | 6,955 | 6,455 | 7,098 |
|
Average broker value for owned fleet (USDm)7 |
414 | 1,235 | 1,474 | 192 | 243 | 603 | – | 4,161 |
1 Annualised
2 ROIC is calculated using annualised EBIT less tax
3 Net loan-to-value is calculated as vessel bank and finance lease debt (excluding debt for vessels sold but pending legal completion)
less cash divided by broker vessel values (100% owned vessels)
4 Excluding six LR1s owned through 50% ownership in the Vista Joint Venture and two MRs owned through 50% ownership in the Andromeda Joint Venture
5 Total operating days include operating days for vessels that are time chartered-in
6 OPEX includes vessel running costs and technical management fees
7 Including Hafnia’s 50% share in six LR1s owned through 50% ownership in the Vista Joint Venture and two MRs owned through 50% ownership in the Andromeda Joint Venture